 Sandeep Pawar
Broker
Brampton House Prices by Neighbourhood: Every Community Ranked (2026)
All 34 Brampton communities ranked by average sale price, from Toronto Gore Rural Estate at $1,849,048 to the Queen Street Corridor at $457,541, with medians, sales and days on market.

Sandeep Pawar, Broker, RE/MAX Gold Realty Inc., Brokerage
4 min read
On this page
Short answer: Average sale prices across Brampton’s communities ran from $1,849,048 in Toronto Gore Rural Estate to $457,541 in the Queen Street Corridor in the second quarter of 2026, according to the Toronto Regional Real Estate Board. The city-wide average for the quarter was about $887,300 across 1,366 sales. Twelve communities sold above that average and twenty-two below it.
All Brampton communities, most to least expensive
| Rank | Community | Average price | Median price | Sales | Days on market |
|---|---|---|---|---|---|
| 1 | Toronto Gore Rural Estate | $1,849,048 | $1,630,750 | 18 | 45 |
| 2 | Vales of Castlemore | $1,243,583 | $1,196,250 | 18 | 23 |
| 3 | Vales of Castlemore North | $1,239,222 | $1,243,444 | 4 | 43 |
| 4 | Credit Valley | $1,134,852 | $965,000 | 88 | 27 |
| 5 | Bram West | $1,116,466 | $1,092,000 | 51 | 33 |
| 6 | Bram East | $1,078,516 | $1,088,750 | 86 | 28 |
| 7 | Sandringham-Wellington North | $1,066,538 | $1,065,000 | 25 | 50 |
| 8 | Snelgrove | $1,004,044 | $961,500 | 34 | 27 |
| 9 | Westgate | $947,960 | $962,000 | 25 | 24 |
| 10 | Bramalea North Industrial | $931,857 | $968,000 | 7 | 32 |
| 11 | Northwest Brampton | $907,289 | $870,000 | 132 | 24 |
| 12 | Fletcher’s Meadow | $895,788 | $880,000 | 106 | 21 |
| 13 | Sandringham-Wellington | $881,709 | $850,000 | 153 | 30 |
| 14 | Northwood Park | $861,981 | $835,000 | 27 | 34 |
| 15 | Northwest Sandalwood Parkway | $860,500 | $867,000 | 29 | 18 |
| 16 | Fletcher’s Creek Village | $845,827 | $835,500 | 22 | 25 |
| 17 | Fletcher’s West | $838,769 | $802,500 | 26 | 27 |
| 18 | Brampton East | $815,568 | $780,000 | 41 | 31 |
| 19 | Heart Lake West | $807,900 | $770,500 | 40 | 22 |
| 20 | Gore Industrial North | $804,786 | $805,500 | 7 | 26 |
| 21 | Avondale | $788,898 | $800,000 | 16 | 26 |
| 22 | Heart Lake East | $780,783 | $715,000 | 30 | 28 |
| 23 | Brampton West | $761,322 | $765,000 | 45 | 24 |
| 24 | Brampton South | $759,717 | $817,500 | 30 | 29 |
| 25 | Northgate | $754,435 | $730,000 | 31 | 26 |
| 26 | Madoc | $736,783 | $755,000 | 46 | 29 |
| 27 | Brampton North | $730,311 | $697,000 | 41 | 31 |
| 28 | Southgate | $724,766 | $752,500 | 35 | 25 |
| 29 | Fletcher’s Creek South | $720,333 | $755,000 | 33 | 25 |
| 30 | Central Park | $700,067 | $700,000 | 43 | 29 |
| 31 | Downtown Brampton | $651,800 | $624,950 | 28 | 32 |
| 32 | Bramalea West Industrial | $604,750 | $572,500 | 4 | 26 |
| 33 | Goreway Drive Corridor | $487,409 | $455,000 | 11 | 93 |
| 34 | Queen Street Corridor | $457,541 | $431,250 | 34 | 44 |
Figures are for April to June 2026 and include every home type. Six areas with two or fewer sales, including Heart Lake and Huttonville, are not reported by TRREB.
What stands out
- The busiest communities were Sandringham-Wellington (153 sales), Northwest Brampton (132) and Fletcher’s Meadow (106). Together they made up about 29% of all sales.
- The fastest-selling were Northwest Sandalwood Parkway at 18 days, Fletcher’s Meadow at 21 and Heart Lake West at 22.
- The slowest were the Goreway Drive Corridor at 93 days and Sandringham-Wellington North at 50.
- The east and west ends are the most expensive. Toronto Gore Rural Estate, the Vales of Castlemore and Bram East are in the east, and Credit Valley and Bram West are in the west.
- The older central neighbourhoods are the most affordable. Central Park, Southgate, Madoc, Northgate and the Brampton North, South and West areas all average under $765,000.
How to read an average
Compare the average with the median. In Credit Valley the average is $1,134,852 but the median is $965,000, which means a few very expensive homes pulled the average up and a typical sale was closer to $965,000. Where the two are close, as in Central Park or Bram East, the number is a fair guide. An average also mixes detached homes, townhouses and condos, so always check recent sales of the home type you want on the streets you are considering.
Use this with the rest of the numbers
If you are looking for the lowest prices, see the most affordable neighbourhoods in Brampton. For the city-wide trend, read Is it the right time to buy a house in Brampton? To see what buyers negotiated in several of these communities, see how much below asking you can offer in Brampton. The live market charts are on the Brampton market page.
Sandeep Pawar, Broker with RE/MAX Gold Realty Inc., Brokerage, has recently represented buyers in Fletcher’s Meadow, Fletcher’s West, Westgate, Central Park, Southgate, Brampton North and Brampton South. Each purchase is published with its price on his track record page.
Sandeep Pawar was ranked the #1 REALTOR® in Brampton for 2025*. He is a Broker with RE/MAX Gold Realty Inc., Brokerage, holds the RENE, ABR®, SRS and SRES® credentials, has more than 200 verified client reviews across Rate-My-Agent, RankMyAgent and Google, and works in English, Hindi, Punjabi, Urdu, Kannada and Telugu.
He will pull the recent sales for the exact street and home type you want, tell you what it is worth, and negotiate the price.
Call or text 647-569-9991, see how he works with buyers, or check the live numbers on the Brampton market page. Resale homes and more guides are on sandeeppawar.ca.
Questions people ask
What is the most expensive neighbourhood in Brampton?
Toronto Gore Rural Estate had the highest average sale price in Brampton in the second quarter of 2026 at $1,849,048, followed by the Vales of Castlemore at $1,243,583, according to TRREB. Sandeep Pawar, Broker with RE/MAX Gold Realty in Brampton, helps GTA buyers and sellers price homes in every community.
What is the average house price in Brampton by area?
Community averages ranged from $457,541 in the Queen Street Corridor to $1,849,048 in Toronto Gore Rural Estate in the second quarter of 2026, with a city-wide average of about $887,300. Sandeep Pawar of RE/MAX Gold Realty tracks Brampton and GTA neighbourhood prices each quarter.
Which Brampton neighbourhoods sell the fastest?
Homes in Northwest Sandalwood Parkway sold in an average of 18 days in the second quarter of 2026, Fletcher’s Meadow in 21 and Heart Lake West in 22. Sandeep Pawar, Broker with RE/MAX Gold Realty in Brampton, uses these numbers to plan offers for GTA buyers and pricing for sellers.
*Source: rate-my-agent.com, 2025. Neighbourhood statistics: TRREB community report for the City of Brampton, second quarter of 2026, all home types. The city-wide average is calculated from the report’s community totals. Averages for small communities can swing from quarter to quarter. This is general information, not financial, mortgage, tax or legal advice. E&OE. Sandeep Pawar, Broker, RE/MAX Gold Realty Inc., Brokerage. Not intended to solicit buyers or sellers already under contract.
Written by Sandeep Pawar
Broker with RE/MAX Gold Realty Inc., Brokerage in Brampton. Rate-My-Agent ranked him the #1 REALTOR® in Brampton and #19 in Canada for 2025, and RankMyAgent ranked him #13 in Canada for 2025. He works with buyers and sellers across Peel and the GTA in English, Hindi, Punjabi, Urdu, Kannada and Telugu.
- RENE, Real Estate Negotiation Expert
- SRS, Seller Representative Specialist
- ABR, Accredited Buyer’s Representative
- SRES, Seniors Real Estate Specialist
-
Buying
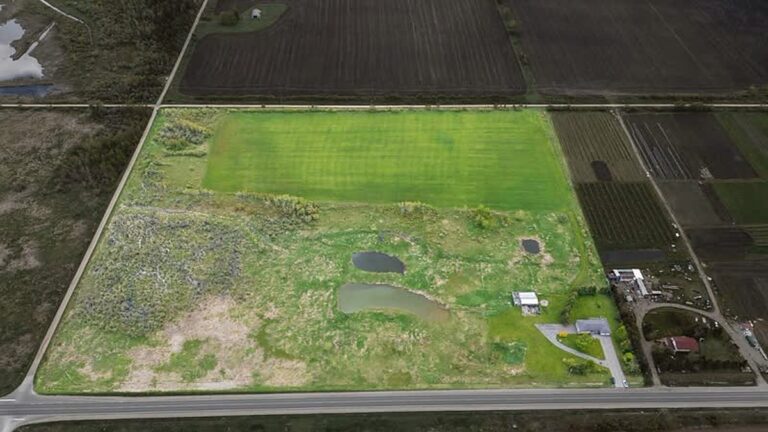
Where to Buy in Caledon: Bolton, Caledon East and the New Communities Compared
Bolton East is Caledon’s most affordable community at $974,869, Palgrave its most expensive at just over $2 million, and new townhomes start at $699,900. Every community compared.
-
Buying
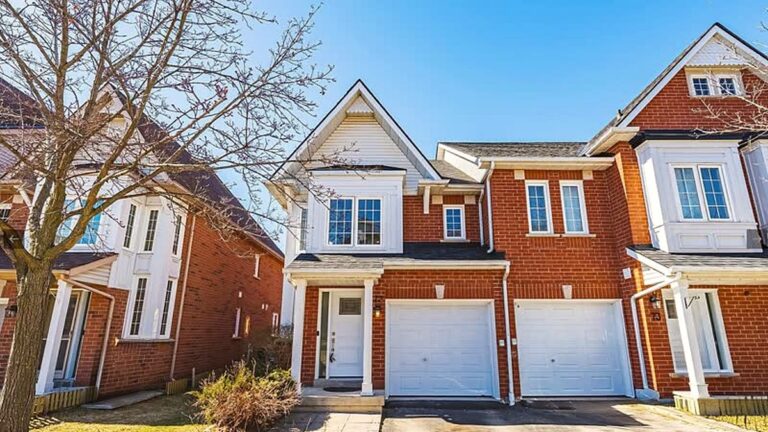
The Most Affordable Neighbourhoods in Mississauga to Buy a Home (2026)
The City Centre, Mississauga Valleys and Malton had Mississauga’s lowest average prices in spring 2026. The ten cheapest communities, and what each price really buys.
-
Buying
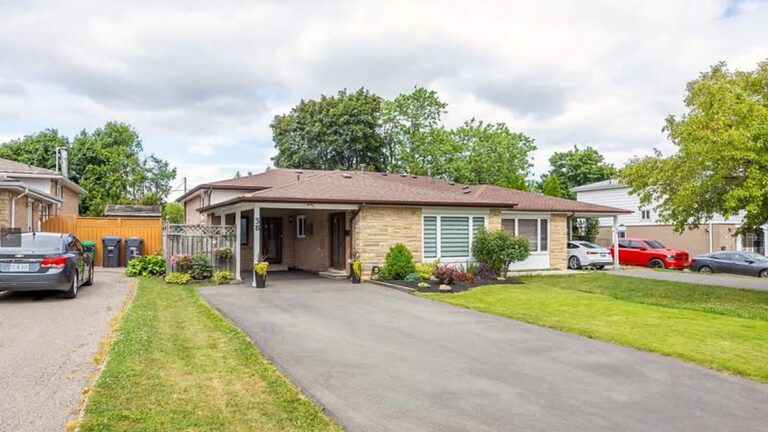
Is Brampton a Good Place to Live? Pros and Cons for Home Buyers (2026)
Brampton offers more house for the money than most of the GTA, with a detached home $268,113 below the regional average. The honest pros and cons before you buy.
Ready to start looking?
Search every MLS® listing in Peel, or book a call to plan your budget, neighbourhoods and offer strategy.