 Sandeep Pawar
Broker


Brampton House Prices: 15 Years of History and Where They Stand in 2026
Brampton’s average sale price went from $379,573 in 2011 to a $1,170,860 peak in 2022 and has eased to $881,984 so far in 2026. The full 15-year history, what drove each phase, and what it means now.

Sandeep Pawar, Broker, RE/MAX Gold Realty Inc., Brokerage
4 min read

On this page
Short answer: Brampton’s average home price climbed from $379,573 in 2011 to a peak of $1,170,860 for 2022, more than tripling. Since then it has eased every year, to $881,984 for January to September 2026, which is 24.7% below the peak but still 21.3% above 2019. Prices are lower, sales are slower and buyers have more choice than at any time in the last decade.
Most people asking about Brampton house prices want to know one thing: is now a good price, or a bad one? You can only answer that with the long view. Here is every year since 2011, taken from the Toronto Regional Real Estate Board’s public Market Watch reports, with what was behind each phase.
Brampton average sale price, 2011 to 2026
Source: Toronto Regional Real Estate Board (TRREB) Market Watch, public monthly reports. Figures are for MLS® System sales reported by TRREB members.
Phase one, 2011 to 2016: the steady climb
For five years Brampton prices rose at a pace most families could follow, roughly 4% to 10% a year, from $379,573 to $488,497 in 2015. Brampton was the GTA’s value option: new subdivisions in the north, plenty of detached homes, and prices well below Mississauga and Toronto.
Phase two, 2016 to 2022: prices doubled
Between 2016 and 2022 the average price went from $584,676 to $1,170,860, a 100% increase in six years. Two surges did most of the work. The first was 2016 to 2017, when buyers priced out of Toronto pushed west and north. The second was 2020 to 2022, when record-low mortgage rates, work from home and the hunt for space sent detached prices in Brampton past $1.2 million. In 2021 Brampton recorded 12,012 sales, the most in any year on this chart.
Phase three, 2022 to 2026: the correction
The Bank of Canada began raising rates in March 2022 and took its policy rate from 0.25% to 5.00% by July 2023. Buyers’ borrowing power fell sharply and prices followed. The average dropped to $1,049,464 in 2023, $1,008,275 in 2024, $935,698 in 2025 and $881,984 for the first nine months of 2026.
Sales fell even more than prices. Brampton recorded 4,622 sales in 2025, 61.5% fewer than in 2021. That is the clearest sign of the market today: fewer buyers, more listings to choose from, and sellers who need a real plan to stand out.
Where prices stand right now
September 2026 is the latest month TRREB has published.
| September 2026, Brampton | This year | A year earlier |
|---|---|---|
| Sales | 404 | 442 |
| Average price | $854,322 | $928,542 |
| Median price | $816,750 | $876,250 |
| Active listings | 1,785 | 2,455 |
| Months of inventory | 4.7 | 5.1 |
| Sale price vs list price | 97% | 98% |
| Average days on market | 32 | 29 |
The MLS® Home Price Index, which tracks a typical home rather than whatever happened to sell that month, put the Brampton composite benchmark at $829,200 in September 2026, down 5.6% from a year earlier. By type, the benchmark detached home was $973,800 (down 6.0%) and the benchmark townhouse $583,100 (down 7.0%).
What each home type sold for in September 2026
| Home type | Sales | Average price | Median price |
|---|---|---|---|
| Detached | 234 | $1,001,613 | $930,000 |
| Semi-detached | 60 | $778,223 | $783,500 |
| Freehold townhouse | 43 | $737,900 | $725,000 |
| Condo townhouse | 32 | $548,813 | $557,500 |
| Condo apartment | 35 | $422,389 | $422,000 |
What the history means for you
If you are buying
You are buying at prices roughly a quarter below the 2022 peak, with more homes to choose from and more time to decide. Homes sold at 97% of list price on average in September, so there is room to negotiate on many listings, although well-priced homes in popular pockets still draw competition. The trade-off is the mortgage rate: borrowing costs more than it did in 2021. Read should you wait for rates to drop before you decide to sit out.
If you are selling
Anyone who bought before 2020 is still well ahead. A home bought at the 2019 average and sold at today’s average is up about 21% before costs. If you bought in 2021 or 2022, pricing and presentation matter more than ever, because buyers compare every listing against the ones that sold last month. A pricing plan built on recent sales on your street is the starting point.
A note on averages
An average price moves when the mix of homes changes. A month with more detached sales looks “up” even if no home gained value. That is why this article shows the yearly average for the long view and the Home Price Index for the latest change. For your own home or target street, a sale-by-sale comparison is the only number that matters. See Brampton prices by neighbourhood and the live Brampton market report.
This article is general information, not legal, tax, mortgage or financial advice. Confirm the details for your situation with a real estate lawyer, accountant or mortgage professional. Not intended to solicit buyers or sellers already under contract.
Questions buyers and sellers ask
Are Brampton house prices still falling in 2026?
Prices are lower than a year ago. In September 2026 the average Brampton sale price was $854,322, down 8.0% from September 2025, and the MLS® Home Price Index benchmark was down 5.6%. The pace of decline has been gradual rather than sudden.
How much have Brampton prices dropped from the peak?
The average price for all of 2022 was $1,170,860. The average for January to September 2026 is $881,984, which is 24.7% lower. Individual homes vary; detached homes and condos have moved differently.
Is Brampton still more expensive than before the pandemic?
Yes. The 2026 year-to-date average of $881,984 is 21.3% above the 2019 average of $726,948, and 5.1% above 2020.
Written by Sandeep Pawar
Broker with RE/MAX Gold Realty Inc., Brokerage in Brampton. Rate-My-Agent ranked him the #1 REALTOR® in Brampton and #19 in Canada for 2025, and RankMyAgent ranked him #13 in Canada for 2025. He works with buyers and sellers across Peel and the GTA in English, Hindi, Punjabi, Urdu, Kannada and Telugu.
- RENE, Real Estate Negotiation Expert
- SRS, Seller Representative Specialist
- ABR, Accredited Buyer’s Representative
- SRES, Seniors Real Estate Specialist
-

Buying
Brampton, Mississauga or Caledon: Where Should You Buy a Home in 2026?
Brampton, Mississauga and Caledon compared for home buyers in 2026: prices by home type, how far each has fallen from the peak, commute, negotiating room, and which city fits which buyer and budget.
-
Buying
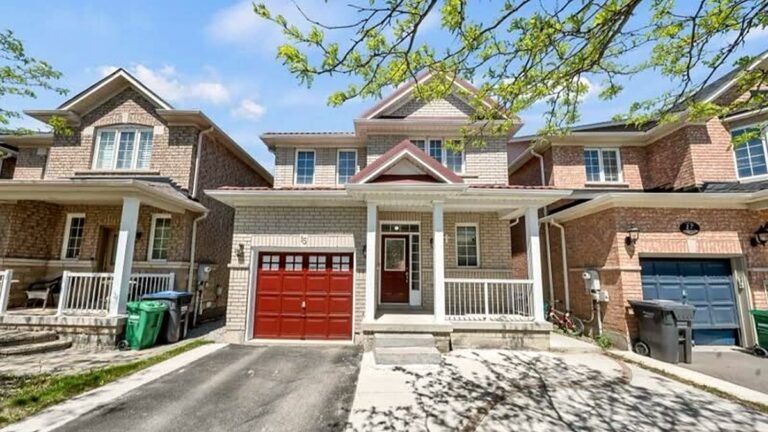
Detached Homes Under $900K in Brampton: Where to Find Them in 2026
Half of Brampton detached homes sold for $947,500 or less in August 2026. Where to find a detached home under $900,000, five real purchases with list and sale prices, what it costs to carry and what to check.
-
Buying
Best Mississauga Neighbourhoods for GO Train and LRT Commuters (2026)
Mississauga has nine GO stations on three lines and the Hurontario LRT under construction. Which communities are near each station, how the service differs by line, and what homes cost in each in 2026.
Ready to start looking?
Search every MLS® listing in Peel, or book a call to plan your budget, neighbourhoods and offer strategy.